Chapter 8 Overview of R & RStudio
Link to conceptual video: https://youtu.be/BFeccMtpttA
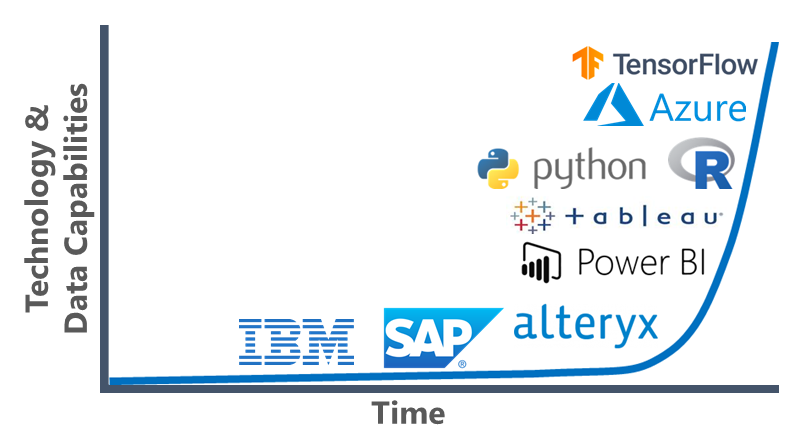
Advances in technology have paved the way for increasingly powerful, sophisticated, and expansive data-analytic tools. Examples of such tools include enterprise solutions by IBM and SAP as well as alteryx, Microsoft Power BI, Tableau, SAS, and Google TensorFlow. At the same time, barriers to entry for using powerful programming languages like R and Python have fallen as the number and quality of educational programs aimed at teaching programming has grown and the amount of free online content has increased.

Compared to working with “off-the-shelf” platforms (e.g., Tableau, SAP), by working directly with programming languages, analysts can design and implement operations, models, and other tools that meet their specific needs. Programming languages allow analysts to define or customize their own functions or apply functions developed by experts around the world. In fact, these languages can have the advantage of getting us closer to our data and understanding and “seeing” the myriad decisions we must make when acquiring, managing, analyzing, and visualizing data.
In this book, we focus specifically on the R programming language (R Core Team 2024). In the following sections, we will learn about about the R programming language itself as well as RStudio (RStudio Team 2020), where the latter is a integrated development environment for R.
8.1 R Programming Language
In the following sections, we will learn answers to the following questions about R:
- What is R?
- Why use R?
- Who uses R?
8.1.1 What Is R?
R is an open-source and freely available statistical programming language and environment that can be used for data management, analysis, and visualization. R is similar to the S language, where the latter was developed at Bell laboratories. You can learn more about R on the R Project website.
R software can be freely downloaded for Windows, MacOS, and Linux operating systems via a Comprehensive R Archive Network (CRAN) mirror. Each CRAN mirror is a server that acts as a repository and distribution site that allows users to download copies of R-related software. Currently, CRAN mirrors are hosted at institutions all over the world, such as the University of Science and Technology Houari Boumediene in Algeria, Univerisiti Putra Malaysia in Malaysia, University of Bergen in Norway, and Indiana University in the United States. Often, R is referred to as base R, which can be useful for distinguishing it from add-on software like RStudio. To learn how to install the base R software, please refer to the following chapter.
8.1.2 Why Use R?
R is a popular tool for managing, analyzing, and visualizing data. Some characteristics that make R particularly attractive are:
- R and its packages are free!
- R allows users to define new functions.
- Due to its open-source nature, R is often fast to react to new advances in data analysis and visualization.
- R is a powerful and constantly evolving language that many employers and educational institutions value.
- R is especially well-suited for ad hoc statistical analysis of data and data visualization.
8.2 RStudio
In the following sections, we will learn answers to the following questions about RStudio:
- What is RStudio?
- Why use RStudio?
- Who uses RStudio?
8.2.1 What is RStudio?
RStudio is an integrated development environment (IDE) for R. RStudio uses base R as its engine and layers on additional features. Although an IDE like RStudio is not required to use R, using R via RStudio has a number of benefits. Namely, RStudio provides a user-friendly interface as well as easy-access to and integration with RMarkdown (Xie, Allaire, and Grolemund 2018; Allaire et al. 2023) and Shiny web applications (Chang et al. 2021), for example. Further, by default, RStudio includes window panes designated for R scripts, the Console, the Environment, and Plots. You can learn more about RStudio at the official website.
Free desktop and server versions of RStudio are available, and you can learn how to download and install the desktop version in the following chapter.
8.2.2 Why RStudio?
RStudio is a popular tool for implementing the R language and environment. Some characteristics that make RStudio particularly attractive are:
- The open-source versions of RStudio Desktop and Server are free to download and use.
- RStudio makes working in R easier, especially for beginners.
- RStudio facilitates report generation, particularly when the the report format remains generally the same over time but the data are updated.
- The RStudio developers hold conferences regularly, which can be great venues to connect with other R users.
8.3 Packages
Although a base R installation comes standard with a number of very useful standard functions, a major advantage of using R is the availability packages with more specialized functions. A package contains a collection of functions, generally with an overarching theme or purpose. For example, the psych package (Revelle 2023) includes a suite of functions that are well-suited to conducting the types of analyses that are common in psychology. As I type this sentence, there are currently over 17,000 available R packages, and you can view the current list of available packages sorted by name by clicking here.
Examples of packages that I demonstrate in this book include: apaTables (Stanley 2021), dplyr (Wickham et al. 2023), ggplot2 (Wickham 2016), lavaan (Rosseel 2012), lessR (Gerbing, Business, and University 2021), psych (Revelle 2023), readr (Wickham, Hester, and Bryan 2024), and tidyr (Wickham, Vaughan, and Girlich 2023).
8.4 Summary
In summary, R is a powerful and widely used programming language and environment, and RStudio is an integrated development environment that layers user-friendly features and helpful tools onto R. Together, they help data analysts and data scientists manage, analyze, visualize, and report data.