Chapter 5 Data Analysis
Link to conceptual video: https://youtu.be/BB53j47ZX-M
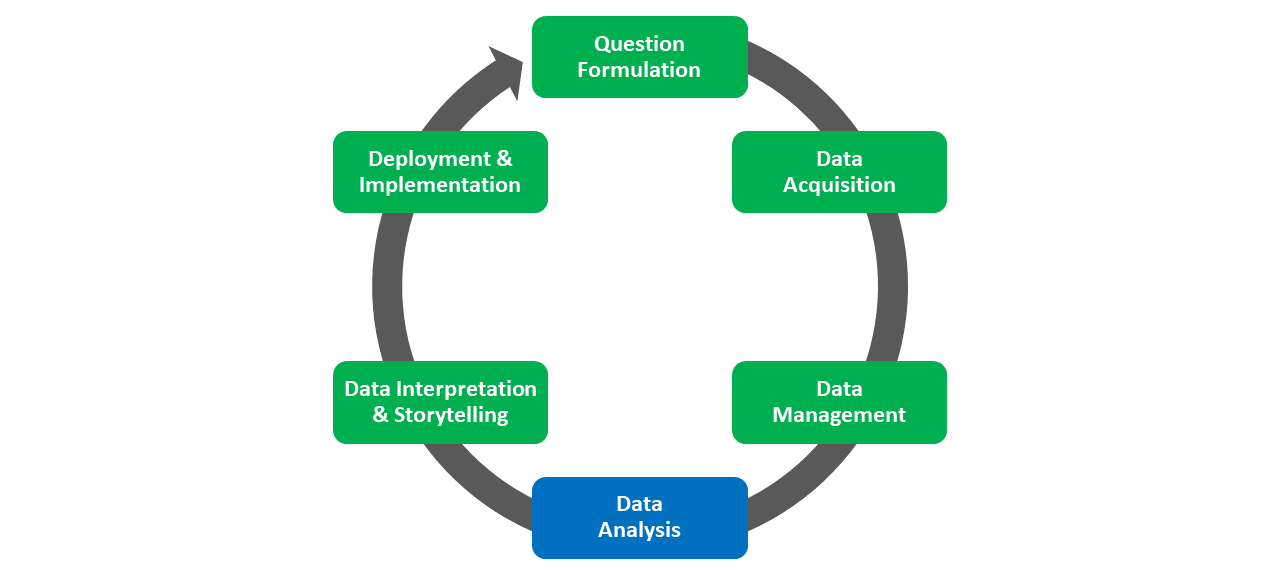
Data analysis refers to the process of applying mathematical, statistical, and/or computational techniques to data to identify associations, differences or changes, or classes (categories), as well as to predict the likelihood of future events, values, or differences or changes. This phase draws upon the data that was acquired and managed during the Data Acquisition and Data Management phases, respectively, of the HR Analytics Project Life Cycle. In this chapter, we will review different data-analysis tools and techniques and the continuum of data analytics.
5.1 Tools & Techniques
A variety of tools and techniques can be used for data analysis, including:
- Mathematics,
- Statistics,
- Machine learning,
- Computational modeling and simulations, and
- Text analyses and qualitative analyses.
5.1.1 Mathematics
With the exception of some forms of qualitative analysis, mathematics acts as the foundation for most data-analysis tools and techniques. Mathematics encompasses a broad array of topics ranging from basic arithmetic to algebra, geometry, and calculus. Even the application of arithmetic and simple counting to data can yield important and valuable insights. For example, a colleague of mine works as an executive coach and shared the following anecdote about a client who was the CEO of a small business. This CEO expressed concern about spending an inordinate amount of time in meetings. In response, my colleague asked how the CEO: “How much time do you spend in meetings each week?” The CEO responded: “I don’t know. How can figure that out?” Finding the answer to the question ended up being relatively straightforward. My colleague asked if the CEO to share their work calendar for the past four weeks, and together they counted up the total number of hours the CEO spent in meetings over the four-week period and then divided by four to compute the weekly average. The issue wasn’t that the CEO was unfamiliar with basic counting and arithmetic; rather, the CEO had never considered that useful data might be acquired from a work calendar and then analyzed using simple math. To me, this anecdote serves as a reminder that even simple forms of data analysis that we learned in primary school can yield valuable insights. Of course, the world of mathematics extends well beyond basic arithmetic to other more-advanced areas like geometry, algebra, and calculus.
5.1.2 Statistics
When we think of data analysis in the context of HR analytics, we often focus on statistics, and thus we’ll spend a bit more time addressing this type of data analysis. Statistics is a branch of applied mathematics used to describe or infer something about a population, where a population could be, for example, all of the employees in an organization. In general, we can differentiate between descriptive and inferential statistics.
Descriptive statistics are used to describe the characteristics of a sample drawn from a population; often, when dealing with data about human beings in organizations, it’s not feasible to attain data for the entire population, so instead we settle for what is hopefully a representative sample of individuals from the focal population. Common types of descriptive statistics include counts (i.e., frequencies), measures of central tendency (e.g., mean, median, mode), and measures of dispersion (e.g., variance, standard deviation, interquartile range). When we analyze employee demographic data, for example, we often compute descriptive statistics like the number of employees who identify with each race/ethnicity category or the average employee age and standard deviation. It’s important to remember that descriptive statistics are, well, descriptive. That is, they help us describe characteristics of a sample, but when computed with data from a sample, they don’t allow us to make inferences about the underlying population from which the sample was drawn.
In contrast, we apply inferential statistics when we wish to make inferences about a particular population based on a sample of data we have collected from that population. A common approach to making these inferences is the application of null hypothesis significance testing (NHST). If you’re familiar with p-values, then you may also be familiar with NHST. For example, in the HR context, we commonly pilot new training programs with a sample of employees and collect outcome data, and then apply an inferential statistical analysis (e.g., independent-samples t-test) to infer whether the new training program will result in significantly better outcomes than the older training program if applied to the overall population of employees.
Two specific types of inferential statistics include parametric and nonparametric statistics. Simply put, parametric statistics make certain assumptions about population parameters and distributions (e.g., normally distributed), whereas nonparametric statistics don’t make these assumptions. Thus, when determining which inferential statistical analysis to apply to a sample of data, we often begin by investigating whether the assumptions for a parametric statistical analysis have been met, and if we don’t find that the data satisfy those assumptions, we then move on to selecting an appropriate nonparametric statistical analysis. Classic examples of parametric statistics include: t-tests, analyses of variance, Pearson product-moment correlations, and ordinary least squares linear regression. Examples of nonparametric statistics include: Mann-Whitney U-test, Kruskal-Wallis one-way analysis, and McNemar’s test.
Inferential statistics of any kind can help us estimate uncertainty about whether a hypothesized difference, association, or change actually exists in the population and to what extent. The concepts of statistical significance and practical significance often come into play in interpretations and discussions of uncertainty. For an introduction to these concepts, please check out the chapter on statistical significance and practical significance.
5.1.3 Machine Learning
Machine learning allows us to extend mathematical and statistical analysis of data - often to very large amounts of data. Specifically, machine learning is form of artificial intelligence in which data are statistically analyzed in ways that allow the “machine” to “learn” when presented with new data (for a brief yet broad overview, see Jordan and Mitchell 2015). Machine-learning algorithms (i.e., models) are often developed for the purposes of making more accurate predictions or classifications – or for finding patterns. For example, an HR data analyst might train, test, and validate a model aimed at accurately predicting who is at-risk for leaving the organization within a given time period. These algorithms can also be applied more broadly to automate processes and systems, with a famous example being how spam emails are detected and assigned to a spam folder (Guzella and Caminhas 2009; Gan 2018).
Let’s distinguish between two types of machine learning: supervised and unsupervised (Oswald and Putka 2016). In supervised learning, the model is trained, tested, and validated on data with labeled variables and with particular types of patterns, predictions, or classifications specified (e.g., decision tree, Lasso regression). In contrast, in unsupervised learning, variables are unlabeled, and structures, patterns, or clusters are inferred from the data, making this type of machine learning more exploratory in nature (e.g., K-means).
5.1.4 Computational Modeling & Simulations
To understand and predict how complex systems behave, we can apply computational modeling and simulations. These tools are particularly useful in contexts in which it might be impractical, difficult (e.g., expensive, resource-intensive), or just not feasible to acquire and analyze real data (for a brief yet broad overview, see Calder et al. 2018). For example, employee interactions are complex and dynamic, and although technologies like sociometric badges enable us to monitor and surveil employee interactions in a mostly unobtrusive manner, such technologies may not be able to capture the specific type of interaction we’re interested in – and they may pose ethical and legal issues. Further, some types of interactions and relationship building may take months – or even years – to emerge, and it may not be practical to wait that long. To address these limitations and concerns, a tool like agent-based modeling (Bonabeau 2002; Smith and Conrey 2007) would allow us to specify evidence-informed characteristics and interaction decision rules (i.e., parameters) for each employee (i.e., agent) within a multi-employee system and to then observe that simulated system over a period of time. About a decade ago, I developed an agent-based model to simulate how employee emotional contagion and aggressive behavior propagate through a social network, which allowed me to understand how different social-network structures might affect the spread of emotion and aggressive behavior. In some sense, these types of simulations allow use to ask and answer “what if” questions.
Other prominent examples of computational modeling and simulations include dynamical systems modeling and Monte Carlo methods, and the data generated by computational models can also be analyzed using the aforementioned data-analysis tools and techniques. Like any modeling technique, computational models are not without their limitations. For starters, the omission of relevant parameters will influence how closely the model approximates reality, and such models may fail to account for real-world unanticipated shocks to a system. Still, computation modeling can be a useful tool for helping us to test theory and to project what can or will happen in the future in complex systems.
5.1.5 Text Analyses & Qualitative Analyses
Text analysis is a large umbrella term for a vast array of analyses aimed at analyzing text data, including quantitative and computer-algorithmic approaches and qualitative-analysis approaches. Let’s start by describing quantitative and computer-algorithmic approaches. These approaches are computer driven and tend to efficient and scalable for large (or very large) amounts of text, and include popular toots and techniques like text mining, sentiment analysis, natural language processing, latent semantic analysis, and (broadly) computational linguistics (see Banks et al. 2018 for a review). As the label implies, quantitative and computer-algorithmic approaches often focus on translating rich sources of qualitative data into quantitative data and metrics. These approaches continue to evolve, which has led to improvements in classification and meaning-meaning extraction accuracy. Compared to a human being, quantitative and computer-algorithmic approaches can struggle to incorporate context and to detect and interpret tone and idiomatic expressions appropriately and accurately.
Qualitative-analysis approaches differ substantially from quantitative and computer-algorithmic approaches in that the former rely primarily on human beings to analyze and interpret text data. The human brain still offers one of the best tools for detecting subtle contextual influences and interpreting tone and idiomatic expressions. With their reliance on the human brain, qualitative-analysis approaches can lead to a richer and more robust understanding of a phenomenon of interest captured in text data. In terms of human work hours, rigorous qualitative analysis can be quite resource-intensive, as it requires iterative coding and sensemaking by (typically) multiple independent human coders. This can make qualitative-analysis approaches less practical and feasible for large amounts of text data. Examples of qualitative analysis include content analysis, thematic analysis, narrative analysis, discourse analysis, and grounded theory (Strauss and Corbin 1997).
5.2 Continuum of Data Analytics
Link to conceptual video: https://youtu.be/lxCaYg1G9fE
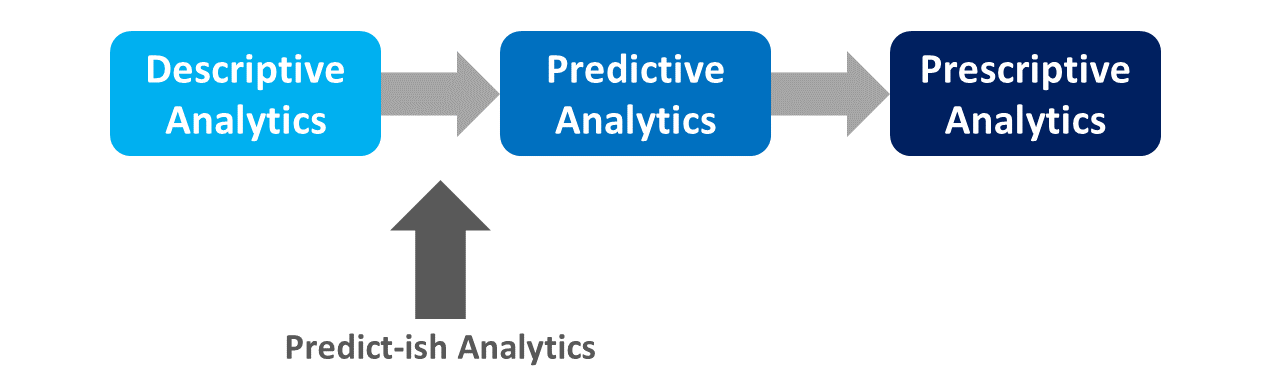
When discussing the Data Analysis phase of the HRAPLC, I would be remiss if I failed to introduce and review the continuum of data analytics. The extent to which an organization does (or does not) engage in the full continuum of data analytics can be an indicator of that organization’s “data-analytics maturity.” In the following sections, we’ll work from descriptive analytics to predict-ish analytics to predictive analytics to prescriptive analytics.
5.2.1 Descriptive Analytics
Let’s begin with descriptive analytics, which falls at the beginning of the data-analytics continuum. We apply descriptive analytics when we wish to apply analyses that describe what has already happened, and thus, descriptive analytics offer a “snapshot” of the past. Common analyses include descriptive statistics (e.g., mean, standard deviation), HR metrics (e.g., turnover rate, time-to-fill), and various types of inferential statistics that we might use to infer whether differences or associations exist in a population (e.g., correlation, t-test). Some hypothetical examples of descriptive analytics include:
- Last year, Unit X had a 34% annual turnover rate while Unit Y had a 5% annual turnover rate.
- A recent survey indicated that 20% of respondents were strongly considering leaving the organization in the next 6 months.
- On average, employees used 15.3 days of paid time off (PTO) last year.
- Higher employee engage was strongly and significantly associated with higher task performance (r = .53, p = .01).

5.2.2 Predict-ish Analytics
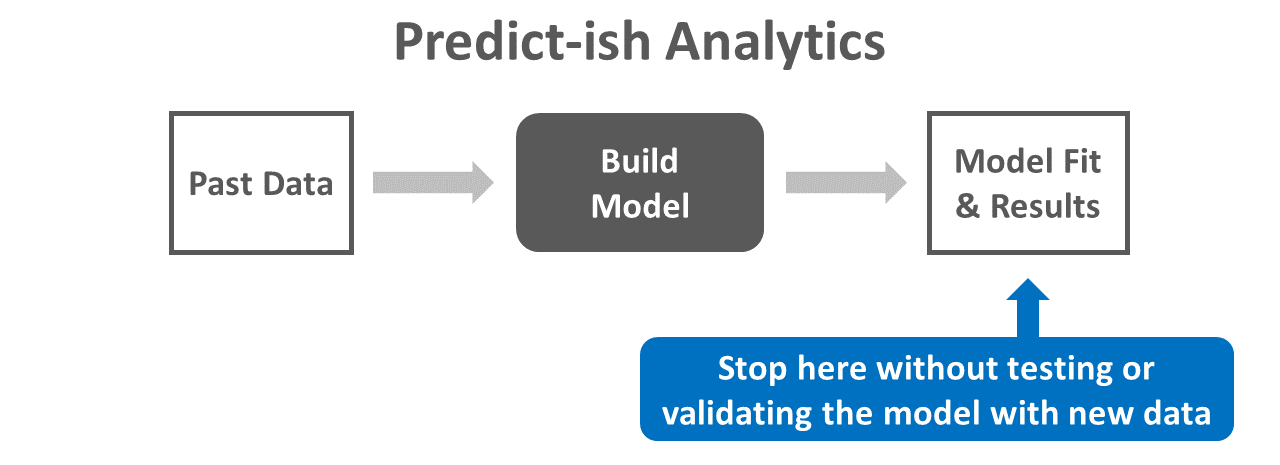
Most discussions of the continuum of data analytics move straight from descriptive analytics to predictive analytics. Let’s, however, take the road less traveled by addressing the space between descriptive and predictive analytics: predict-ish analytics. You probably haven’t heard of predict-ish analytics before because, well, it’s a term I made up, as many ad-hoc data-analyses in HR analytics end up in this space. I define predict-ish analytics as the estimation of models that can predict what will happen in the future based on a snapshot of data from the past – but that don’t actually verify what will happen in the future and how accurate the original model’s predictions were. In other words, predict-ish analytics stops a bit shy of proper predictive analytics. Often predict-ish analytics take the form of inferential statistical analyses without cross-validation of any kind, and a major shortcoming is that this approach is prone to model overfitting on past data, making it unlikely that the model will fit future data well.
As a hypothetical example of predict-ish analytics, imagine the following. An HR analytics team collected data from job incumbents as part of a criterion-related validation study. The team estimated a simple linear regression model by regressing scores for a job performance rating tool on scores on a structured interview selection tool. The results indicated that higher scores on the structured interview were positively and significantly associated with higher job performance ratings (b = 2.98, p = .02), such that for every 1-point increase in structured interview scores is associated with increase of 2.98 points in job performance ratings. The team has not, however, evaluated the accuracy of their model by applying it to a new sample of data from the intended population.
5.2.3 Predictive Analytics
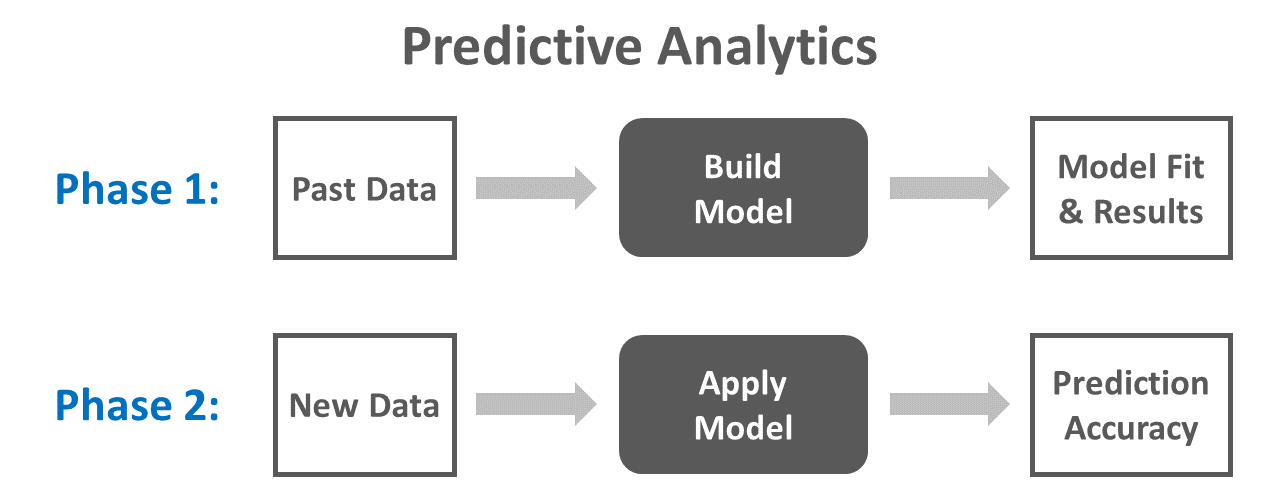
Unlike descriptive analytics, predictive analytics focuses on the future. That being said, predictive analytics initially looks to the past. More precisely, predictive analytics refers to the process of estimating a model based on past data in order to predict what will happen in the future, and then testing and validating how accurate the model’s predictions are when the model is applied to new data. One of the classic examples of predictive analytics is the cross-validation of an inferential statistical model (e.g., linear regression model). Other more-advanced forms of predictive analytics involve applying machine-learning procedures or computational modeling.
As a hypothetical example of predictive analytics, imagine the following scenario. Using available data from the previous year, an HR analyst estimated a logistic regression model with voluntary turnover (i.e., stayed vs. quit) as the outcome of interest and employee engagement and task performance as predictors. The results indicated that engagement and task performance both significant predictors of who would quit over the subsequent 6 months based on the initial sample of data, and more specifically, both engagement and task performance were negatively associated with turnover, such that those with lower engagement and task performance were more likely to quit. At the end of the following year, the analyst applied the model to new data that had been acquired for employee engagement, task performance, and voluntary turnover, and the analyst found that the model predicted who would quit and who would stay with 85% accuracy.
5.2.4 Prescriptive Analytics
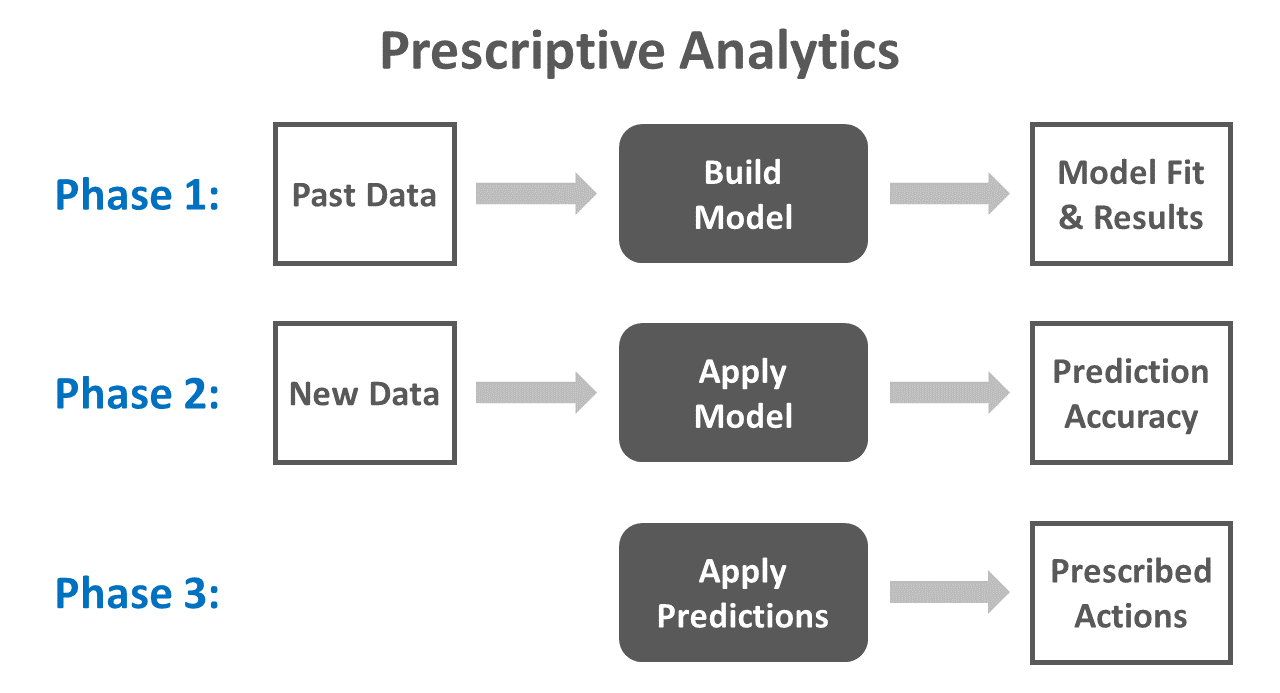
At the far end of the continuum of data analytics sits prescriptive analytics. Prescriptive analytics takes predictive analytics to the next level by prescribing action and making targeted recommendations based on predictive-analytics findings. That is, in addition to interpreting the results of the predictive-analytics process, prescriptive analytics involves taking those results and coming up with evidence-informed interventions, recommendations, and actions.
To illustrate how prescriptive analytics might work in practice, let’s continue with the hypothetical example that I provided for predictive analytics (see above). As a reminder, the model was focused on predicting who would voluntarily turnover based on engagement and task performance scores. Because the model predicted who would quit and how would stay with 85% accuracy, the HR analyst prescribed the following actions:
- The model should be applied at the beginning of each year to identify those individuals who have a higher probability of voluntarily turning over, allowing managers to check in with at-risk employees with greater frequency.
- Where feasible, the organization should redesign jobs to improve employee engagement, as lower engagement was found to be one of the drivers of voluntary turnover.
- In order to improve employee task performance, the organization should train managers how to deliver constructive feedback, as lower task performance was found to be one of the drivers of voluntary turnover.
5.3 Summary
In this chapter, we took a tour of the Data Analysis phase of the HR Analytics Project Life Cycle. Along the way, we learned about common tools and techniques for data analysis, including mathematics, statistics, machine learning, computational modeling and simulations, and text analyses and qualitative analyses. We concluded our tour by reviewing the continuum of data analytics, ranging from descriptive analytics to predict-ish analytics to predictive analytics to prescriptive analytics.