Chapter 6 Data Interpretation & Storytelling
Link to conceptual video: https://youtu.be/pwLg6SM35tQ
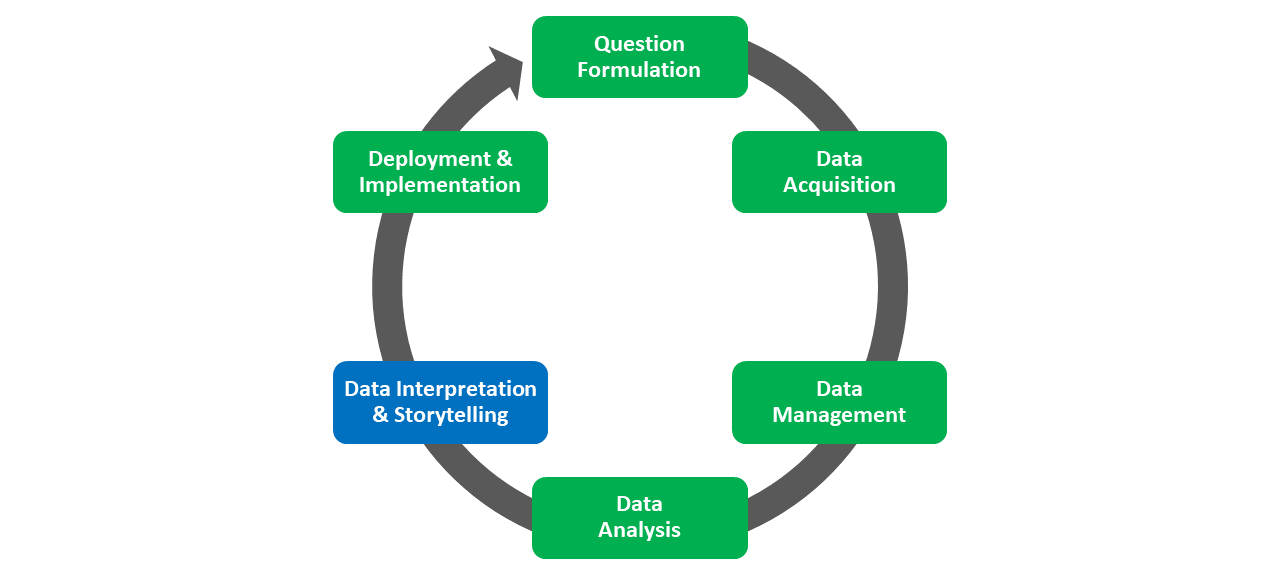
Data interpretation and storytelling refers to the process of making sense of data analysis findings and evaluating questions and hypotheses, as well as disseminating the findings to different stakeholders. To support data interpretation and storytelling with data, data visualizations are commonly used (e.g., graphs, charts, plots, dashboards). This phase draws upon the results of the Data Analysis phase of the HR Analytics Project Life Cycle. In this chapter, we will review different data-analysis tools and techniques and the continuum of data analytics.
Effective data interpretation and storytelling relies on the following:
- Recognizing the role of human decision making and judgment (including biases) when interpreting data-analytic findings;
- Understanding the context in which the data used for analysis were acquired and the context in which the story about the data will be told;
- Connecting the data-analytic findings back to the original problem or question to evaluate what (if any) solutions or answers may be informed by the findings;
- Acknowledging and honoring the needs and knowledge of the stakeholders to whom the story will be told;
- Focusing on effective communication, connection, and clarity with stakeholders when telling a story about data-analytic findings and interpretations.
6.1 Data Interpretation
At this moment in time, data interpretation is still mostly a human endeavor. That is, human beings are still one of the best resources we have when it comes to interpreting the results of data analyses. In particular, humans are capable using their potentially rich knowledge of the context (e.g., population from which data were sampled; organizational history) and theory with data-analytic findings. With that being said, two people who come from different backgrounds and who have different knowledge, skills, and abilities may interpret the same findings differently, especially when it comes to the perceived practical significance of the findings. A difference in interpretation need not necessarily be a bad thing, though, as it can lead to meaningful conversations and potentially new problems that need solutions and questions that need answers. Still, we must keep in mind that humans routinely make judgment and decision-making errors and apply cognitive biases, which can lead to poor data interpretations as well as poor question formulation, data acquisition, data management, and data analysis. For more information, please check the chapter on judgment, decision making, and bias.
Although I treat Data Analysis and Data Interpretation & Storytelling as distinct phases in the HR Analytics Project Life Cycle, analysis and interpretation often occur iteratively, such that an analyst jumps back and forth between the two phases. For example, an analyst might analyze the association between employees’ levels of job satisfaction and their level of supervisor-rated performance, and then interpret the statistical and practical significance of that finding; based on their interpretation, the analyst may decide to then analyze whether that association between job satisfaction and job performance is the same or different across organizational units, followed by interpretation of the results.
6.2 Storytelling
Storytelling is an innate part of the human experience and is often used to facilitate shared learning and knowledge acquisition. Humans often construct stories to make sense of and explain their experiences – even when they’re not instructed to do so. For example, the story model from the juror decision making literature posits that jurors construct verbal narratives and mental representations of trial-related events to make sense of the information they’re presented with and to arrive at a verdict (Bennett and Feldman 1981; Devine 2012; Denning 1986; Pennington and Hastie 1993). In fact, jurors’ own life events and perceptions shape the story they construct.
We can define a story as an account of a connected succession of events that is intended to instruct, inform, spur interest, and/or entertain (LiteraryTerms.net n.d.; Merriam-Webster.com n.d.; Dictionary.com n.d.). And by extension, storytelling is the process of communicating a story ourselves or to others. Telling a story can be done used any mode of communication, such as written words, spoken words, imagery, body language, music, and physical performance. Within HR analytics, we often create data visualizations (e.g., charts, graphs, plots) to support a broader story we are attempting to tell, which can be referred to more specifically as storytelling with data.
In the business context, storytelling may take on a strategic purpose, which can be called strategic storytelling. To that end, an Organizational Performance Consultant named Seth Kahan described strategic storytelling as follows (Denning 2006).
“In my work at NASA, I coached leaders on how to tell stories that accelerate positive change. The first thing these leaders needed to realize is that their primary goal is to make change happen, not to be seen as a good storyteller. It’s immaterial whether or not listeners are aware that a story is being told, much less that they admire the story. However, the listeners’ reactions in response to the story are critical. We are looking for changes in behavior that align with the leaders’ objectives. When that happens you have a powerful change agent equipped with a powerful tool.”
6.2.1 Structure
Whether intentional or not, a story unfolds with a narrative structure, which includes the key parts or components of the story and the order in which they are presented. The linear structure is perhaps the simplest, as it partitions the story into a beginning, middle, and end – in that order. That being said, often even the simplest linear structures deploy tension in some manner, and storytellers often create tension that is in need of a resolution, leading to a climax of some kind (e.g., Freytag’s Dramatic Structure). Using tension effectively has the potential to foster greater audience engagement and interest.
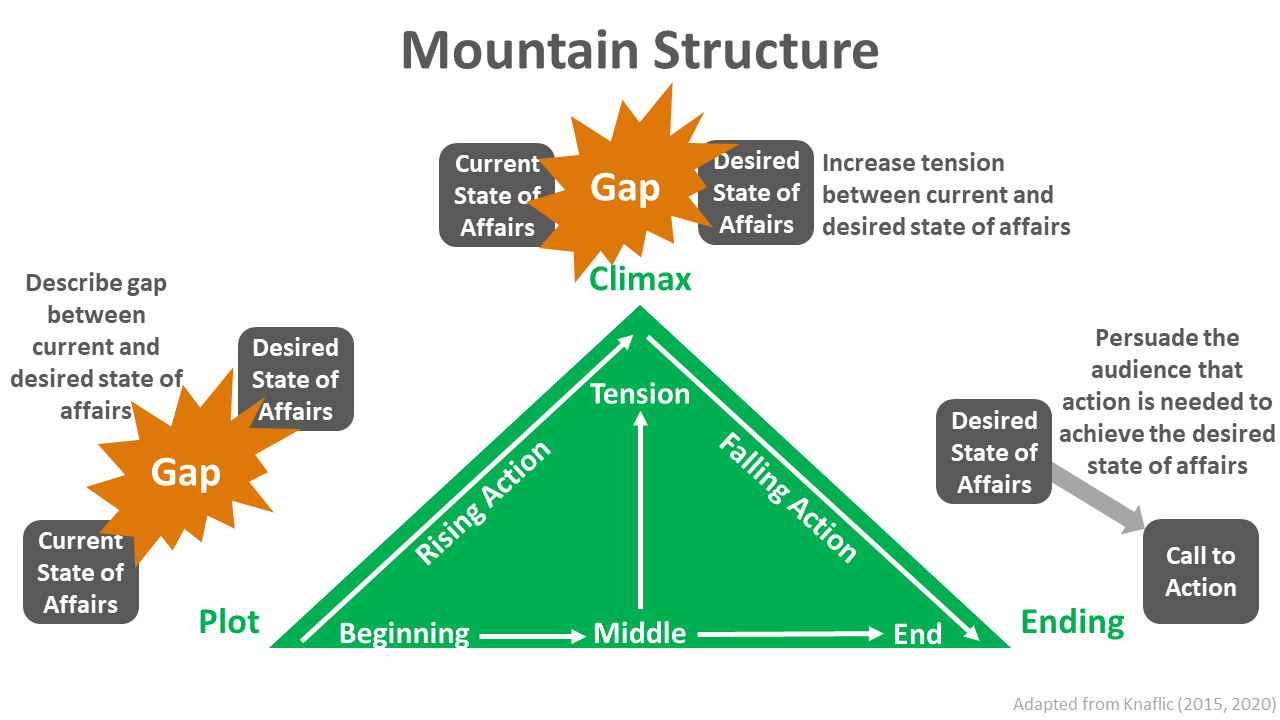
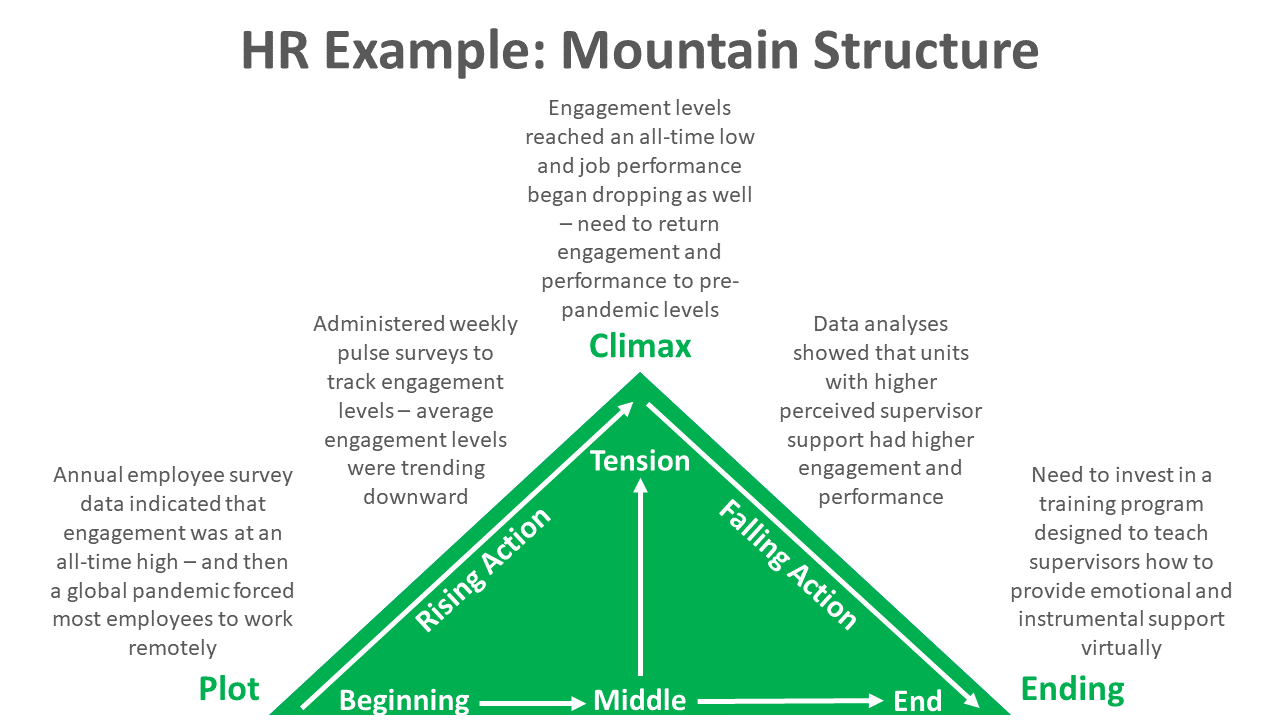
The mountain structure is a common storytelling structure (Knaflic 2015, 2020). This structure begins with the introduction of the plot. The plot includes providing needed context for the story and describing a gap between the current state of affairs and a desired state of affairs is introduced to the audience. To draw the audience into the story, it’s often helpful to provide “eye-catching,” provocative, or “shocking” information, as this can signal to the audience why they should care about the story you’re beginning to tell.
After introducing the plot, the story builds tension through rising action to ultimately arrive at the climax, where the tension between the current and desired states of affairs reaches its peak. Arriving at the climax can be an opportunity to articulate the problem that needs a solution or the question that needs an answer.
After the climax, the story resolves the tension until the ending – and in the case of strategic storytelling, falling action leads to a call to action wherein the story attempts to persuade the audience that some action is needed to achieve the desired state of affairs. If a problem (or question) was set up earlier in the story, the ending is where solutions to the problem can be offered (or answers to the question).
6.2.2 Clarity & Parsimony
Particularly in the case of strategic storytelling, it’s advisable to tell a story that is both clear and parsimonious. That is, avoid convoluted and complicated narratives that distract from the central message that the story is intended to communicate. Generally, I recommend identifying 1-3 points that you would really like for the audience to remember and/or act on – and telling a parsimonious story with deliberate and thoughtful repetition can facilitate this process. When telling stories using visual a visual medium (e.g., data visualization, PowerPoint presentation), sometimes there is a tendency to fill every available space with words or images. Often, however, it is more effective to leave unused visual space and to avoid unnecessary visual clutter. Similarly, in written and oral presentations, I recommend prioritizing brevity over verbosity and using silence before or after key ideas to create a sense of dramatic importance.
To help achieve clarity and parsimony, I recommend focusing on a particular problem that needs a solution or a question that needs an answer. Doing so can help to ensure that your story will stay focused and on message. Further, towards the end of a story, sometimes it is helpful to remind the audience of the focal problem or question – and then tie the key takeaway points (e.g., call to action) back to the problem or question.
6.2.3 Influence & Persuasion
In the case of strategy storytelling, our goal is often to influence and persuade the audience to feel, think, or do something, and thus it’s worthwhile to unpack what influence and persuasion entail. Influence – or social influence – refers to “change in preferences or behavior that one individual or group causes in another,” and as a specific form of influence, persuasion is the “active attempt by an individual, group, or social entity (e.g., government, political party, business) to change a person’s beliefs, attitudes or behaviors by conveying information, feelings, or reasoning” (Cacioppo, Cacioppo, and Petty 2018). For example, in HR we might try to persuade:
- decision makers to invest in a data-informed employee retention initiative;
- HR professionals to build data-literacy skills;
- decision makers to support the development or acquisition of selection methods that leverage artificial intelligence (AI);
- front-line managers to check in and provide feedback regularly with their employees regarding their performance.
When used effectively, influence and persuasion tactics can help HR analytics teams move from the Data Interpretation and Storytelling phase of the HR Analytics Project Life Cycle to the Deployment and Implementation phase. More specifically, influence and persuasion can facilitate the leap from knowledge acquired through data interpretation and storytelling to prescribed action that can be deployed and implemented in the organization – a process that is sometimes referred to as closing the “knowing-doing gap” (Pfeffer and Sutton 2000).
For persuasion to lead to meaningful change in the audience, it is important to (a) recognize the boundaries of your own expertise, (b) understand the audience, (c) craft the message, and (d) tell the story.
6.3 Data Visualization
When storytelling with data, data visualizations (e.g., graphs, charts, dashboards) can serve as useful tools. In the conceptual video below, I review data visualization from the perspective of human cognition and decision making, as it’s important to consider how those who view data visualizations will perceive, think about, and make decisions using the information contained within the display.
Link to conceptual video: https://youtu.be/er1JboU3YGI
6.4 Summary
In this chapter, we learned about the role of the Data Interpretation and Storytelling phase of the HR analytics Project Life Cycle, including how to tell an effect story. To learn more about how we talk about statistical findings, please refer to the chapter on language considerations.