R for HR:
An Introduction to Human Resource Analytics Using R
Version 0.1.7: 2024-06-21
Preface
This book is free to read and is licensed under the Creative Commons Attribution-NonCommercial-ShareAlike 4.0 International License. The contents of this book may not be used for commercial purposes. This is Version 0.1.7 of this book, which means that it is in a nearly complete form and will undergo further editing and expansion.
0.1 Growth of HR Analytics
The term human resource analytics can mean different things to different people and to different organizations. Further, human resource analytics sometimes goes by other names like people analytics, talent analytics, workforce analytics, and human capital analytics. While some may argue for distinctions between these different names, for this book, I will treat them as interchangeable labels. Moreover, for the purposes of this book, human resource (HR) analytics is defined as the “process of collecting, analyzing, interpreting, and reporting people-related data for the purpose of improving decision making, achieving strategic objectives, and sustaining a competitive advantage” (Bauer et al. 2025, 42).
The foundation of HR analytics formed over a century ago with the emergence of disciplines like industrial and organizational (I/O) psychology. In recent decades, advances in information technology and systems have reduced the time HR professionals spend on transactional and administrative activities, thereby creating more time and opportunity for transformational activities supporting the realization of strategic organizational objectives. HR analytics has the potential to play an integral role in such transformational activities, as it can inform HR system design (e.g., choosing selection tools, validating selection tools) and high-stakes decision making involving people-related data from the organization.
0.2 Skills Gap
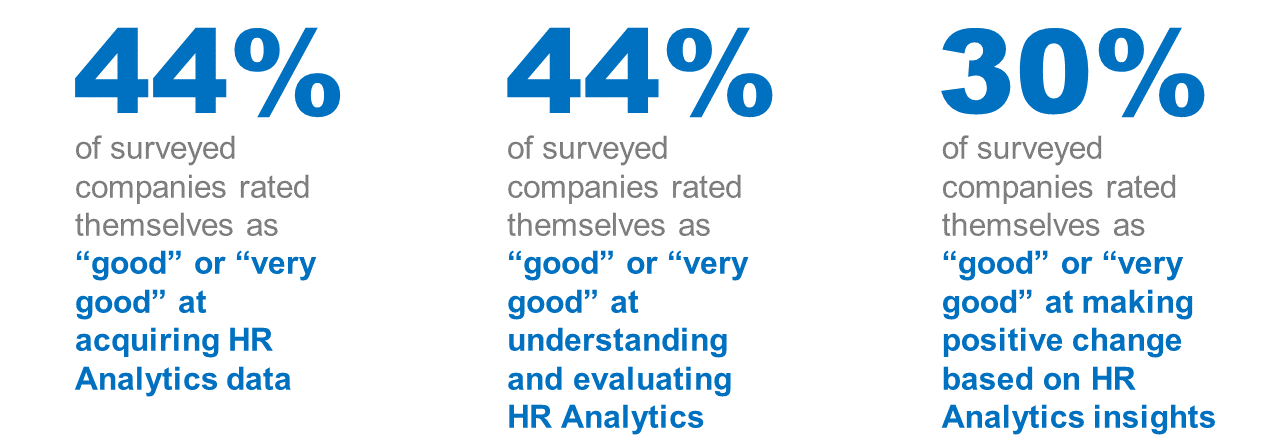
Although many organizations regard HR analytics as strategically important for organizational success, today many of those same organizations face an HR analytics talent shortage. To some extent, the talent shortage can be attributed to data literacy – or the lack thereof. Historically, academic and professional HR training and development opportunities did not emphasize data-literacy skills, and this omission has left organizations today scrambling to hire external talent or to close the skills gap of existing HR professionals.
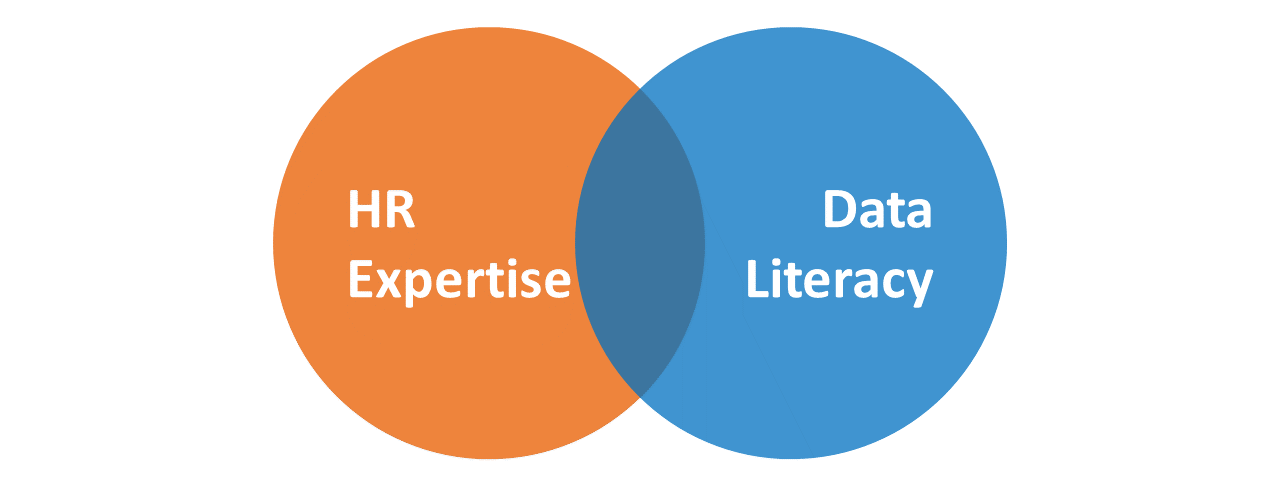
To address the HR analytics talent shortage and skills gap, organizations have, broadly speaking, two options. First, for some organizations, closing the skills gap may be as straightforward as hiring a “quant” (e.g., data scientist, statistician), provided the individual works closely with HR professionals when working with data associated with HR systems, policies, and procedures, and identifying HR-specific legal and ethical issues. Second, I would argue that for most organizations perhaps a better alternative is to close the skills gap among current HR professionals, as their HR-specific knowledge, skills, abilities, and other characteristics (KSAOs) offer tremendous value when deriving insights from HR data as well as a solid domain-specific foundation for subsequently layering on data-literacy KSAOs. Importantly, those with existing HR domain expertise presumably have working knowledge of prevailing employment and labor laws and experience with anticipating and uncovering ethical issues, both of which are necessary when acquiring, managing, analyzing, visualizing, and reporting HR data.
0.3 Project Life Cycle Perspective
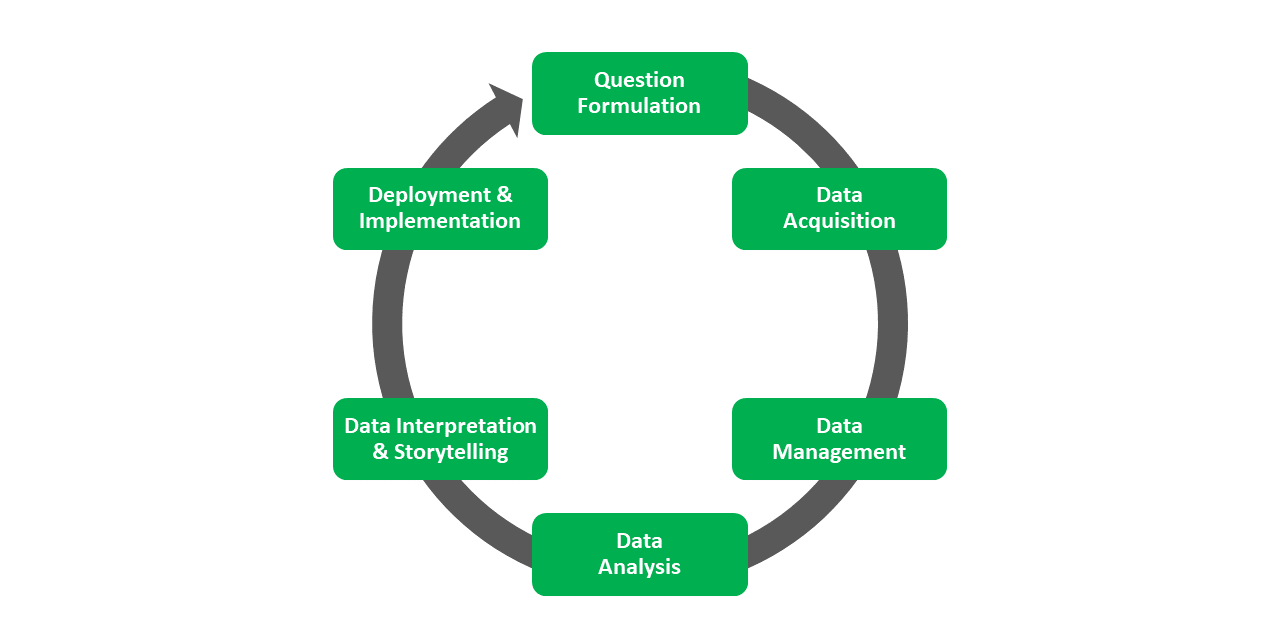
When building efficacy in HR analytics, I have found that it’s helpful to envision where and how contributions can be made at the project level and which specific KSAOs are required at each phase. To that end, I developed the HR Analytics Project Life Cycle (HRAPLC) as a way to conceptualize the prototypical phases of a generic project life cycle. These phases include: Question Formulation, Data Acquisition, Data Management, Data Analysis, Data Interpretation and Storytelling, and Deployment and Implementation. I dedicate Part 1 of this book to providing a conceptual overview of the HRPLC in Chapters 1-7.
0.4 Overview of HRIS & HR Analytics
If you are just looking for a basic overview of HR information systems (HRIS) and HR analytics, consider checking out the following introductory video.
Link to conceptual video: https://youtu.be/3X7qmb1M39A
And if you are looking for an introduction to human resource management with supplementary Excel-based tutorials and data exercises, I recommend checking out one of the following textbooks I co-authored:
- Bauer, T. N., Erdogan, B., Caughlin, D. E., & Truxillo, D. M. (2025). Human resource management: People, data, and analytics (2nd ed.). Thousand Oaks, CA: Sage
- Bauer, T. N., Erdogan, B., Caughlin, D. E., & Truxillo, D. M. (2020). Fundamentals of human resource management: People, data, and analytics. Thousand Oaks, CA: Sage.
0.5 My Philosophy for This Book
Working with data does not need to be scary or intimidating; yet, over the years, I have interacted with students and professionals who carry with them what I refer to as a numerical phobia or quantitative trauma. Unfortunately, at some point in their lives, some people begin to believe that they are not suited for mathematics, statistics, and/or generally working with data. Given these psychological barriers, a primary objective of this book is to make data analytics – and HR analytics specifically – relevant, accessible, and maybe even a little fun. In early chapters, my intention is to ease the reader into foundational concepts, applications, and tools in order to build self-efficacy in HR analytics incrementally. The tutorials in each chapter are grounded in common and (hopefully) meaningful HR contexts (e.g., validating employee selection tools). As the book progresses, I introduce more challenging statistical concepts and data-analytic techniques. Reading this book and following along with the in-chapter tutorials will not lead to expert-level knowledge and skill; however, my hope is that working through this book will do the following:
- Build excitement for working with data to inform decision making.
- Instill a sense of intellectual curiosity about data and a hunger to expand boundaries of expertise.
- Inspire further in-depth training, education, and learning in areas and topics introduced in this book.
- Enhance data literacy, including knowledge and skills related to (a) critical thinking and logic, (b) mathematics, statistics, and data analysis, and (c) data visualization and storytelling with data.
0.5.1 Rationale for Using R
Today, we have the potential to access and use a remarkable number of statistical and data-analytic tools. Examples of such tools include (in no particular order) R, Python, SPSS, SAS, Stata, MatLab, Mplus, Alteryx, Tableau, PowerBI, and Microsoft Excel. Notably, some of these programs can be quite expensive when it comes to user licensing or subscription costs, which can be a barrier to access for many.
Programming languages like R and Python have several desirable qualities when it comes to managing, analyzing, and visualizing data. Namely, both are free to use, and both have an ever-growing number of free (add-on) packages with domain- or area-specific functions (e.g., data visualizations). It is beyond the scope of this Preface to provide an exhaustive comparison of the relative merits of R versus Python; however, when it comes to the statistical analysis of data, specifically, I argue that R provides a more user-friendly entry point for beginners as well as more advanced capabilities desired by expert users, especially for ad-hoc analyses. Moreover, the integrated development environment program called RStudio (which “sits on top of” base R) offers useful workflow tools and generally makes for an inviting environment.
That said, Python has been catching up in these regards, and I wouldn’t be surprised if Python closes these gaps relative to R in the next few years. I would be remiss if I didn’t mention that the Python language is powerful and has capabilities that extend far beyond the management, analysis, and visualization of data. Fortunately, learning R makes learning Python easier (and vice versa), which means that this book can serve as a springboard for learning Python or other programming languages; in fact, RStudio allows users to create and run Python code. Finally, I believe it to be unlikely that one tool (e.g., program, language) will emerge that is ideal for every task, and thus, I encourage you to build familiarity with multiple tools so that you develop a “toolbox” of sorts, thereby allowing you to choose the best (or at least better) tool for each task.
0.5.2 Audience
I have written this book with current or soon-to-be HR professionals in mind, particularly those who have an interest in upskilling their data-analytic knowledge and skills.This book can provide a meaningful context for learning key data-analytic concepts, applications, and tools that are applicable beyond the HR context. Relatedly, this book may serve as a user-friendly gateway and introduction to the programming language called R for those who are interested in other non-HR domains.
0.6 Structure
This book consists of the following parts and associated chapters:
- HR Analytics Project Life Cycle:
- Overview of HR Analytics Project Life Cycle
- Question Formulation
- Data Acquisition
- Data Management
- Data Analysis
- Data Intrepretation & Storytelling
- Deployment & Implementation
- Introduction to R:
- Overview of R & RStudio
- Installing R & RStudio
- Getting Started with R & RStudio
- Basic Features & Operations of the R Language
- Setting a Working Directory
- Data Acquisition & Management:
- Reading Data into R
- Removing, Adding, & Changing Variable Names
- Writing Data from R
- Arranging (Sorting) Data
- Joining (Merging) Data
- Filtering (Subsetting) Data
- Cleaning Data
- Manipulating & Restructuring Data
- Centering & Standardizing Variables
- Removing Objects from the R Environment
- Employee Demographics:
- Introduction to Employee Demographics
- Describing Employee Demographics Using Descriptive Statistics
- Summarizing Two or More Categorical Variables Using Cross-Tabulations
- Applying Pivot Tables to Explore Employee Demographic Data
- Employee Surveys:
- Introduction to Employee Surveys
- Aggregating & Segmenting Employee Survey Data
- Estimating Internal Consistency Reliability Using Cronbach’s alpha
- Creating a Composite Variable Based on a Multi-Item Measure
- Employee Training:
- Introduction to Employee Training
- Evaluating a Post-Test/Post-Test without Control Group Design Using Paired-Samples t-test
- Evaluating a Post-Test-Only with Control Group Design Using Independent-Samples t-test
- Evaluating a Pre-Test/Post-Test with Control Group Design Using an Independent-Samples t-test
- Evaluating a Post-Test-Only with Two Comparison Groups Design Using One-Way ANOVA
- Employee Selection:
- Introduction to Employee Selection
- Investigating Disparate Impact
- Estimating Criterion-Related Validity of a Selection Tool Using Correlation
- Predicting Criterion Scores Based on Selection Tool Scores Using Simple Linear Regression
- Estimating Incremental Validity of a Selection Tool Using Multiple Linear Regression
- Applying a Compensatory Approach to Selection Decisions Using Multiple Linear Regression
- Applying a Noncompensatory Approach to Selection Decisions Using Angoff Method
- Testing for Differential Prediction Using Moderated Multiple Linear Regression
- Statistically & Empirically Cross-Validating a Selection Tool
- Employee Separation & Retention:
- Introduction to Employee Separation & Retention
- Computing Monthly & Annual Turnover Rates
- Estimating the Association Between Two Categorical Variables Using Chi-Square (\(\chi^2\)) Test of Independence
- Identifying Predictors of Turnover Using Logistic Regression
- Applying k-Fold Cross-Validation to Logistic Regression
- Understanding Length of Service Using Survival Analysis
- Employee Performance Management:
- Introduction to Employee Performance Management
- Evaluating Convergent & Discriminant Validity Using Scatter Plots & Correlations
- Investigating Nonlinear Associations Using Polynomial Regression
- Supervised Statistical Learning Using Lasso Regression
- Investigating Processes Using Path Analysis
- Estimating a Mediation Model Using Path Analysis
- Evaluating Measurement Models Using Confirmatory Factor Analysis
- Estimating Structural Regression Models Using Structural Equation Modeling
- Estimating Change Using Latent Growth Modeling
- Employee Compensation & Reward Systems:
- Introduction to Employee Compensation & Reward Systems
- Preparing Market Survey Data
- Estimating a Market Pay Line Using Linear & Polynomial Regression
- Identifying Pay Determinants Using Hierarchical Linear Regression
- Computing Compa Ratios & Investigating Pay Compression
- Odds & Ends:
0.9 Acknowledgements
My inspiration for writing and compiling the contents of this book stems from interactions with countless colleagues, professional acquaintances, and undergraduate and graduate students. A broad “thank you” is in order for anyone with whom I have taught or had a conversation about data analytics and data science. Further, I want to thank Liz Harman for lending her copy-editing skills to this book, David Gerbing for the many conversations we have shared about teaching R using his lessR package (Gerbing, Business, and University 2023) and his introductory R data analysis textbook, and Sam Caughlin for creating the cover art for this book. Finally, I created this book using the following programs and packages: R (R Core Team 2024), RStudio (RStudio Team 2020), rmarkdown (Xie, Allaire, and Grolemund 2018; Allaire et al. 2023), knitr (Xie 2015, 2014, 2023b), and bookdown (Xie 2016, 2023a).